CAPA airline profit outlook
The CAPA world airline industry operating margin model forecasts that margins will fall from 2016 to 2018, suggesting that the estimate of 8.3% in 2016 may have been a cyclical peak. The Jan-2017 update of CAPA's six monthly world airline profit outlook, which adds 2018 to the model for the first time, attributes the expected declining margin trend to increases in oil prices and the rate of fleet growth.
The CAPA world airline industry operating margin model forecasts that margins will fall from 2016 to 2018, suggesting that the estimate of 8.3% in 2016 may have been a cyclical peak. The Jan-2017 update of CAPA's six monthly world airline profit outlook, which adds 2018 to the model for the first time, attributes the expected declining margin trend to increases in oil prices and the rate of fleet growth.
Moreover, although global economic growth is forecast by the IMF to pick up in each year from 2016 to 2018, there are many uncertainties surrounding the world economy. The IMF's Jan-2017 outlook warns that risks to global growth are skewed to the downside.
However, previous cyclical peak margins did not exceed 6% and the CAPA model forecasts that the industry's operating margin will remain higher than this throughout the forecast period, provided that the downside risks to the global economy do not materialise. Putting the forecast into an historical context, the world's airline industry is set to remain in a period of unprecedentedly high profitability, at least until 2018.
The key inputs to the CAPA world airline operating margin model are world GDP growth, growth in the global fleet of commercial jet aircraft and Brent crude oil prices. The outputs are world RPK growth and operating margin.
The main differences between CAPA's Jan-2017 model and the last forecast published in Jul-2016 are as follows:
- Estimate of 2016 margin raised slightly from 8.2% to 8.3%, in line with IATA's most recent figure, published in Dec-2016. Higher RPK growth (raised from 5.7% to 6.2%) and slightly lower oil prices (from USD45.2 to USD43.6 per barrel) are only partially offset by slightly higher fleet growth (from 3.8% to 3.9%);
- Forecast of 2017 margin is increased slightly from 7.2% to 7.4% due to lower oil price outlook (lowered from USD58.2 to 57.4), partially offset by fractionally lower traffic growth (6.4% versus 6.5%);
- Forecasts for 2018 added for the first time An increase in fleet growth and oil prices relative to 2017, only partially mitigated by slightly higher RPK growth, lead to forecast operating margin falling from 7.4% in 2017 to 6.6% in 2018.
The CAPA world airline industry operating margin model forecasts margins will fall through the forecast period from an estimate of 8.3% in 2016 to 7.4% in 2017 and 6.6% in 2018. In essence, the reasons for the declining trend are increases in oil prices and in fleet growth through the period.
CAPA world airline operating margin model Jan-2017
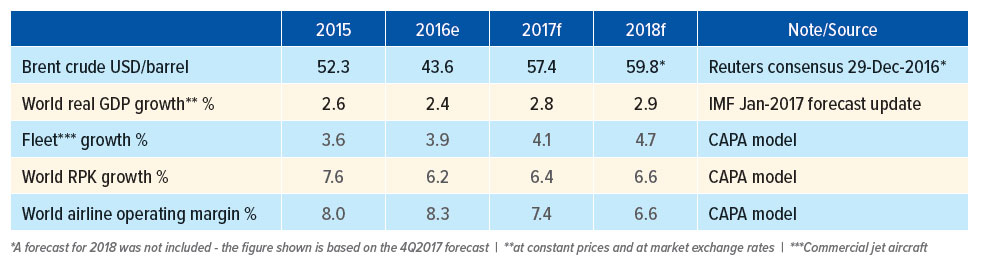
Nevertheless, these forecast margins for the world's airline industry are unprecedented in an historical context.
In previous decades, the airline industry operating margin had peaked at around 6% or lower, before turning into the downswing of the cycle. It then typically fell to somewhere just below zero at the bottom of the cycle (although it hit a much lower trough of -5% in 2001 after the 9/11 terrorist attacks).
Before the current decade, the midpoint of the operating margin cycle was only around 2%.
The upswing that began in 2011 led to margins scaling new heights, reaching 8.0% in 2015 and probably improving on this slightly in 2016. Even if the operating margin falls to the level of 6.6% in 2018 predicted by the CAPA model, this will still mean that there will have been a period of four consecutive years of margins above previous cyclical peaks.
This points to the real possibility that the industry can sustain a new midpoint of the cycle at a higher margin level than in the past. However, this will not be fully confirmed until it has been through a full downswing.
As discussed in the last update to CAPA's forecasts, published in Jul-2016, there have been a number of factors contributing to the industry's structural improvement in profitability. These include achieving higher rates of traffic growth from given levels of economic growth; greater capacity discipline (especially in the consolidated US industry); new revenue sources; and lower oil prices.
World airline industry operating margin (% of revenue) 1975 to 2018F
 Industry Operating Margin" width="700" height="276" />
The global economic outlook is for GDP growth below its historic trend rate, but rising. The IMF's 16-Jan-2017 forecast update made no change to its global GDP growth forecasts relative to its Oct-2016 version. This stabilisation of its outlook for the world economy followed almost two years of cuts to its forecasts.
Nevertheless, the Jan-2017 IMF forecast of global GDP growth was a small downward revision from its Jul-2016 version, which was used
in CAPA's last airline operating margin model (the IMF updates its forecasts four times a year, while CAPA's model is updated six monthly).
As a result of the IMF's changes from Jul-2016, the headline global GDP growth forecast for 2016 used in CAPA's model is lowered from 2.5% to 2.4%. For 2017, it is lowered from 2.9% to 2.8%. For 2018, added to the CAPA model for the first time, global GDP growth is forecast by the IMF at 2.9%. (Note that these GDP growth rates are based on world GDP calculated at constant prices and at market exchange rates.)
The IMF expects economic activity to gather pace in 2017 and 2018, particularly in emerging market and developing economies. However, it also sounded a note of caution, arguing that the balance of risks to global growth was to the downside.
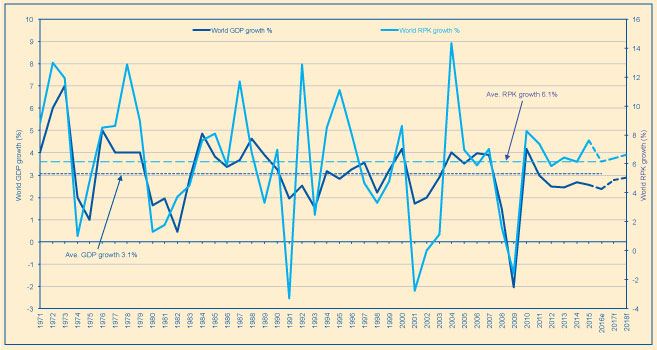
World GDP growth* and world Airline RPK growth 1971 to 2016E
In particular, the new US administration is something of an unknown quantity, but brings protectionist rhetoric into the mix. Europe faces general elections in France and Germany and the start of Brexit negotiations. Lower commodity prices have weakened some low income economies.
Moreover, in spite of the accelerating GDP growth in each year of the IMF forecast, these figures remain below the long term average rate of 3.1%.
RPK growth looks set to remain above historic trend rate, in spite of below trend economic growth. The CAPA model's first output, world RPK growth forecasts, are driven by the GDP growth outlook for each year, with adjustments made to the current year to reflect year to date reported figures from IATA.
According to IATA, world RPK growth for the first 11 months of 2016 was 6.1%, in line with the long term average annual rate of growth between 1971 and 2015. CAPA's estimate of 6.2% RPK growth for the whole of 2016 assumes that Dec-2016 experienced a slightly higher growth rate, reflecting the fact that Dec-2015's growth was a below-average 5.4%.
RPK growth is then forecast at 6.4% for 2017 and 6.6% for 2018, broadly reflecting the rising GDP growth forecast in each year.
World GDP growth has not exceeded its long term average of 3.1% since 2010, when it reached 4.2% and RPK growth reached 8.3%. In the six years since then, world GDP has failed to recover to its long term average, let alone to beat it, yet RPK growth has been above its long term average of 6.1% in five of those six years.
As previously discussed by CAPA in the Jul-2016 forecast update, the higher traffic growth from a given level of GDP growth in the current decade probably reflects two factors.
First, faster growing emerging markets have an increasing share of world airline traffic (and world GDP). Second, LCCs have a growing share of traffic, with a consequent stimulating impact on demand growth of lower fares.
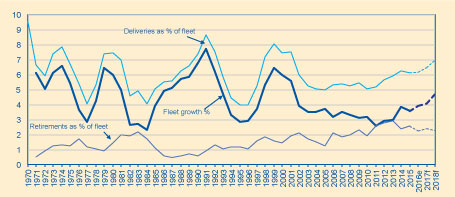
Fleet growth is rising, indicating a loosening of capacity discipline. After GDP growth, the second input to the CAPA world airline operating model is annual growth in the fleet of commercial jet aircraft. The improved capacity discipline of the world airline industry can be seen in its historical context by lower rates of fleet growth over the past decade than in previous times.
In previous cycles, peak fleet growth often coincided with, or just preceded, the bottom of the airline margin cycle. An increase in the rate of supply growth can lead to extra downward pressure on airline yields and any indication of accelerating fleet growth can be an early warning sign of weaker airline industry profitability.
Fleet growth is estimated at 3.9% in 2016, still below its long term average rate of 4.4% for 1971 to 2015. Although fleet growth has been low in an historical context, there has been a steady increase in the figure since it fell to 2.6% in 2011.
Moreover, according to the CAPA model, the outlook for fleet growth is a further creeping up of the rate of increase. It is forecast to rise from 3.9% in 2016 to 4.1% in 2017, before stepping up to 4.7% in 2018. This would be the first time since 2001 that fleet growth exceeds its historic long term average rate of 4.4%.
The CAPA forecast implies that fleet growth in each of the years 2016, 2017 and 2018 is higher than any year since 2001. This slackening of capacity discipline is a cause of some unease; even if fleet growth is still some way short of previous peak growth rates of more than 7%.
World airline industry deliveries and retirements as a % of fleet* and growth in fleet 1971 to 2015
One of the key drivers of increasing rates of fleet growth is the relatively low fuel price environment since mid-2014. The fall in Brent crude oil prices from a range of USD100 to USD120 per barrel in 2011-2014 to a range of roughly USD40 to USD60 since early 2015, and the resultant fall in jet fuel prices, has helped to keep some older aircraft in the air and has stimulated accelerating capacity growth.
Brent Crude USD per barrel Jan-2000 to Jan-2017
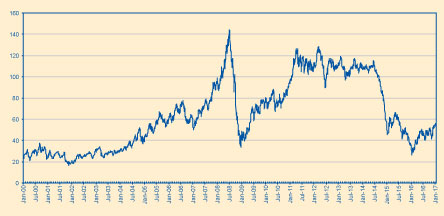
For its third input, the CAPA model takes Brent crude oil price forecasts from the most recent monthly consensus poll published by Reuters (in this case, the one on 29-Dec-2016). This gave an average Brent price forecast of USD57.4 per barrel in 2017 (compared with an USD43.6 in 2016). It did not yet give a forecast for 2018, but the CAPA model takes the figure of USD59.8 for 4Q2017 and extrapolates into 2018.
Oil prices are even more difficult to forecast than GDP growth, but there is now a broad consensus that the period of falling prices has come to an end following an agreement among OPEC members and several other major producers to limit supply. The most likely direction is now expected to be broadly upwards, even if prices are likely to remain well below the USD100 to USD120 range of a few years ago.
Lower oil prices also contributed to a fall in global airline industry revenue since 2014, through the mechanism of lower unit revenue. An industry where capacity growth leads to revenue contraction would seem to be suffering from too much supply.
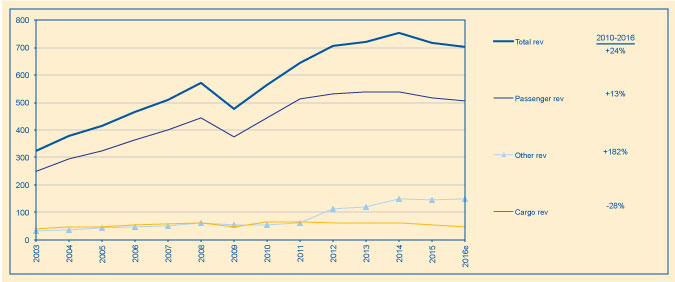
According to IATA estimates, total airline industry revenue fell 7% from 2014 to 2016, in spite of total ATK growth of 5.4% in 2015 and 6.3% in 2016. Passenger revenue fell 6%, while cargo revenue tumbled 24%. Nevertheless, other revenue remained flat over this period.
The past two years notwithstanding, other revenue has been an important contributor to revenue growth since 2010. Between 2010 and 2016, total airline revenue increased by 24%, passenger revenue increased by 13% and cargo revenue contracted by 28%, but other revenue increased by a factor of 2.8 times. Other revenue more than doubled its share from 9% to 21% of total revenue.
This latter category consists of every other activity carried out by the world's airlines, including MRO, catering and other non-flying services, but also ancillary revenue. A more detailed breakdown is not available, but ancillaries seem likely to be the main driver of the increase.
To some extent, the increase in ancillary revenue reflects a reallocation of existing revenue, but it does also appear that the industry is widening its revenue base. Moreover, there is undoubtedly an opportunity for airlines to develop genuinely new ancillary revenue sources.
The main driver of profit growth since 2014 has been lower fuel costs. Increased revenue from new sources may have been a contributory factor to improved airline industry profitability, particularly since 2011. However, since 2014, other revenue has not grown and, as noted total revenue has fallen. Nevertheless, industry operating margin broke through its previous peak level of 6% to beat 8% in 2015 and 2016.
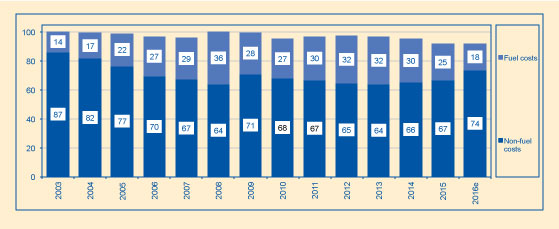
For much of the decade to 2014, fuel costs were in the region of 30% of revenue, reaching as high as 36% in 2008. In 2015, fuel costs fell to 25% of revenue, the lowest since touching 22% in 2005.
In 2016, according to IATA, fuel costs were just 18% of revenue, the lowest since 2004. In 2017, as oil prices are forecast to rise versus 2016, fuel costs as a percentage of revenue may not change significantly due to the delaying impact of fuel hedging policies followed by many airlines.
World airline: revenue by category (USD billion) 2003 to 2016e
World airline industry fuel costs and non-fuel costs as a percentage of revenue 1971 to 2016e
However, this will depend on the extent of any oil price increase and on the direction of revenue growth. The impact of rising oil prices on airline costs is likely to be greater in 2018.
The fall in fuel costs since 2014 has been accompanied by an increase in non-fuel costs. Prior to 2014, non-fuel costs had steadily fallen as a percentage of revenue, from 87% in 2003 to 64% in 2013 as the industry embarked on a creditable phase of cost restructuring.
However, non-fuel costs then crept up to 66% of revenue in 2014, rising to 67% in 2015 and 74% in 2016 (according to IATA). The increase in non-fuel costs as a percentage of revenue since 2014 partly reflects the fall in revenue, but there has also been an increase in absolute terms. Non-fuel costs increased 5% from 2014 to 2016, while revenue fell 7%.
In terms of unit cost, the cost per ASK (CASK) for the global airline industry fell by 20% between 2014 and 2016. The bulk of this fall was thanks to a 51% reduction in fuel CASK, while unit revenue fell by 17% over the same period.
World airline industry cask and rask (usc) 2006 to 2016e
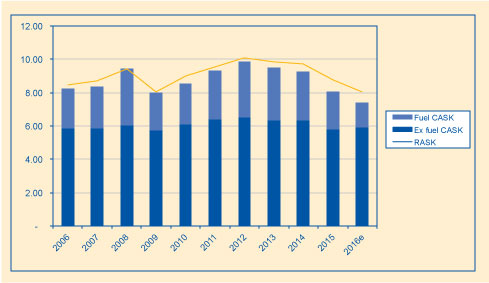
However, while ex fuel CASK came down by only 7% over the two years from 2014 to 2016 and actually rose by 2% in 2016. Buoyed by the "free" cost saving of cheaper fuel, the industry appears to have been distracted from its task of cutting ex fuel CASK.
RASK is expected to continue to be weak in 2017, even if oil prices start to tick upwards. In an environment of falling unit revenue, caused first by lower fuel prices and then extended by rising capacity growth, cost control is crucial, particularly with regard to ex fuel unit cost. In any given market segment, airlines with the lowest CASK have an advantage against those attempting to rely on a RASK premium to sustain margins.
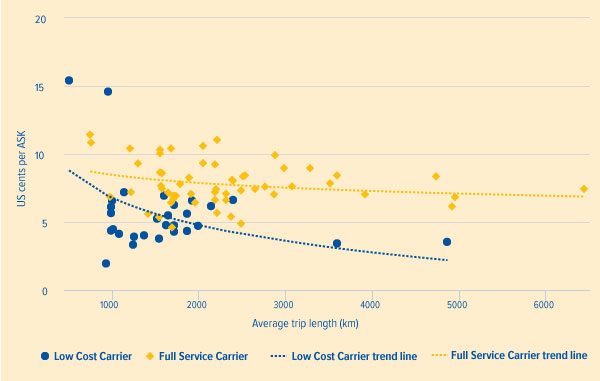
There is a wide range of levels of unit cost among the world's airlines, with a clear delineation between most full service and low cost carriers. There are also wide differences in CASK within the FSC and LCC categories, as illustrated by the chart below, sourced from the CAPA CASK database.
World airlines cost per available seat kilometre (CASK, USC) versus average passenger trip length (km) 2015*
Discipline over capacity and costs will limit margin downside. With falling revenue and rising non-fuel costs, only a fall in fuel costs (down by 20% from 2014 to 2016), has allowed the world's airline industry to increase its operating margin over the past two years.
If fuel costs are now to rise once more, as currently forecast, the challenges for the industry will be to retighten its capacity discipline, thereby helping to shore up unit revenue, and to renew its efforts to cut non-fuel costs. These actions will be necessary in order to limit the downside to industry margins as they come down from the peak.
The airline industry's profitability is likely to remain cyclical, but if it can restrict the fall in margins in a downswing so that the midpoint of the cycle is higher than in previous decades, this will be a significant achievement.